


Cornelius Real Estate Market Update April 2018
Cornelius Real Estate Market Stats for April 2018
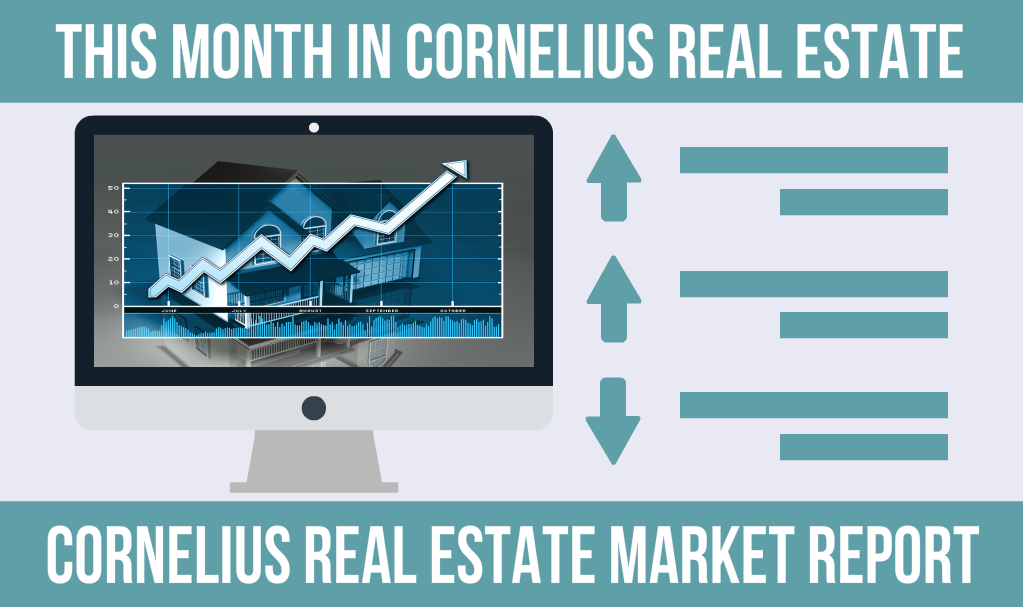
Cornelius Homes
In April 2018 56 homes sold in the Cornelius area, a 47.4% increase from the 38 Cornelius homes sold in March 2018. April 2018 sales figures increased 5.7% from April 2017 when 53 homes sold in the Cornelius real estate market.
The average sales price in Cornelius increased 16.6% from $528,292 in March to $615,888 in April. The April 2018 average sales price increased 40.4% from the April 2017 average sales price which was $438,696.
Average days on the market decreased 26.2% from 61 days in March to 45 days on the market in April. The April 2017 average days on the market were 63, an 28.6% decrease in market time from one year ago.
Currently there are 166 active homes for sale in the Cornelius real estate market, up 16.1% from April. The average list price is $967,694 up 3.1% from the April average list price of $938,768. 106 Cornelius homes are currently under contract, down 1.9% from April. Based on these statistics, 3.0 months of inventory, we are currently in a sellers real estate market in Cornelius.
It is a great time to sell Cornelius real estate! Request a free market analysis or keep updated on the Cornelius real estate market for free at LakeNormanHomePrices.com
Cornelius Condos & Townhomes
In April 2018 26 condos/townhomes sold in the Cornelius real estate market, a 13% increase from the 23 Cornelius condos or townhomes sold in March. April 2018 sales figures decreased 18.8% from April 2017 when 32 Cornelius condos sold.
The average sales price increased 4.2% from $231,402 in March to $241,110 in April. The April 2018 average sales price increased 6.9% from the April 2017 average sales price which was $225,505.
Average days on the market decreased 20% from 20 in March to 16 in April. April 2017 average days on the market were 39, a decrease of 59% market time from one year ago.
Currently there are 46 active condo/townhomes for sale in the Cornelius real estate market, an 84% increase from the 25 Cornelius condos for sale in April. The average list price is $367,476, up 43% from April’s average list price of $257,070. 35 Cornelius condos/townhomes are currently under contract, a 0% decrease from April. Based on these figures, 1.8 months of inventory, we are currently in a sellers market for Cornelius condos.
Cornelius Lots
In April 1 lots sold in the Cornelius area, a 50% decrease from the 2 Cornelius lots sold in March. April 2018 sales figures decreased 75% from April 2017 when 4 Cornelius lots sold.
The average sales price increased 394% from $161,000 in March to $795,000 in April. The April 2018 average sales price increased 49% from the April 2017 average sales price which was $535,000.
Average days on the market increased 75% from 4 in March to 7 in April. The April 2017 average days on the market were 211, a 97% decrease in market time versus the same time period last year.
Currently there are 34 active lot listings in the Cornelius real estate market, an increase of 13.3% from April. The average list price is $780,772, up 5% from April’s average list price of $743,738. 7 Cornelius lots are currently under contract, a 133% increase from April. Based on these numbers, 34 months of inventory, we are in a buyers market for Cornelius lots for sale.
Search Cornelius homes for sale
Cornelius waterfront homes for sale
Search Cornelius condos for sale
Cornelius waterfront condos for sale
Would you like to stay up to date on the Cornelius real estate market: Free Cornelius Real Estate Market Updates
Leave a Reply
You must be logged in to post a comment.
