Tag Archives: Cornelius Real Estate For Sale
Cornelius Real Estate Market Update April 2019

Cornelius Real Estate Market Stats for April 2019
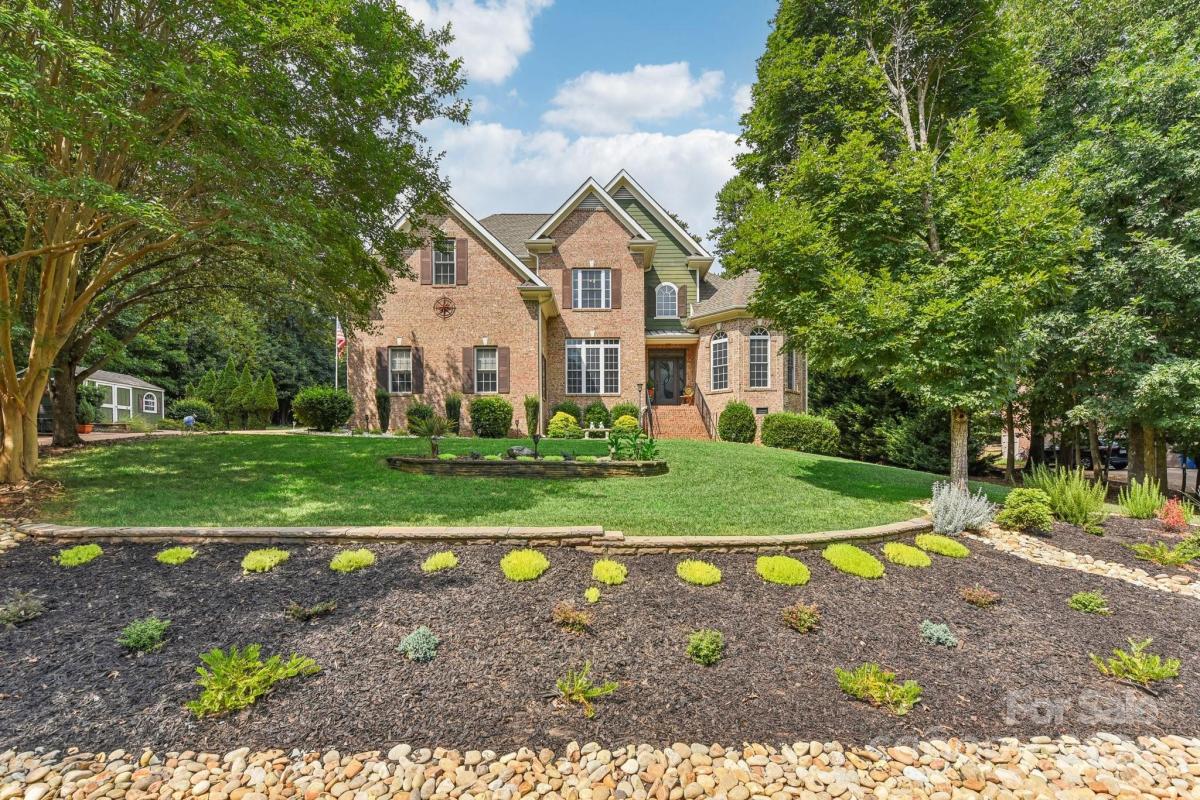
Cornelius Homes
In April 2019 36 homes sold in the Cornelius real estate market, a 16.3% decrease from the 43 Cornelius homes sold in March 2019. April 2019 sales figures decreased 35.7% from April 2018 when 56 homes sold in the Cornelius real estate market.
The average sales price in Cornelius increased by 27.9% from $467,100 in March to $597,350 in April. April 2019 average sales price decreased 3% from the April 2018 average sales price which was $615,888.
Average days on the market decreased by 13% from 69 days in March to 60 days on the market in April. The April 2018 average days on the market were 45, a 33% increase in market time from one year ago.
Currently, there are 153 active homes for sale in the Cornelius real estate market, down 2.5% from April. The average list price of active listings is $940,063 up 3.4% from the April average list price of $909,049. There are 104 Cornelius homes currently under contract, up 15.5% from April. Based on these statistics, 1.1 months of inventory, we are currently in a seller’s real estate market in Cornelius.
It is a great time to sell Cornelius real estate! Request a free market analysis or keep updated on the Cornelius real estate market for free at LakeNormanHomePrices.com
Cornelius Condos & Townhomes
In April 2019 19 condos/townhomes sold in the Cornelius real estate market, a 30% decrease from the 27 Cornelius condos or townhomes sold in March 2019. April 2019 sales figures decreased 27% from April 2018 when 26 Cornelius condos sold.
The average sales price increased by 11% from $210,649 in March to $233,818 in April. The April 2019 average sales price decreased 3% from the April 2018 average sales price which was $241,110.
Average days on the market decreased by 0% from 40 in March to 40 in April. The April 2018 average days on the market were 16, an increase of 150% market time from one year ago.
Currently, there are 61 active condo/townhomes for sale in the Cornelius real estate market, a 3.2% decrease from the 63 Cornelius condos for sale in April. The average list price is $291,483, down 13.3% from April’s average list price of $336,069. 37 Cornelius condos/townhomes are currently under contract, a 5.1% decrease from April. Based on these figures, 1.1 months of inventory, we are currently in a seller’s market for Cornelius condos.
Cornelius Lots
In April 2019 1 lots sold in the Cornelius area, a 50% decrease from the 2 Cornelius lots sold in March 2019. April 2019 sales figures increased 0% from April 2018 when 1 Cornelius lots sold.
The average sales price decreased by 54% from $348,500 in March to $160,000 in April. The April 2019 average sales price decreased 80% from the April 2018 average sales price which was $795,000.
Average days on the market increased by 256% from 76 in March 2019 to 271 in April 2019. The April 2018 average days on the market were 7, a 3771% increase in market time versus the same time period last year.
Currently, there are 21 active lot listings in the Cornelius real estate market, a decrease of 4.5% from April. The average list price is $874,367, up 4.4% from April’s average list price of $837,809. There are 8 Cornelius lots currently under contract, an 11% decrease from April. Based on these numbers, very limited Cornelius land inventory, we are in a seller’s market for Cornelius lots for sale.
Search Cornelius homes for sale
Cornelius waterfront homes for sale
Search Cornelius condos for sale
Cornelius waterfront condos for sale
Would you like to stay up to date on the Cornelius real estate market: Free Cornelius Real Estate Market Updates
Cornelius Real Estate Market Update March 2019
Cornelius Real Estate Market Stats for March 2019
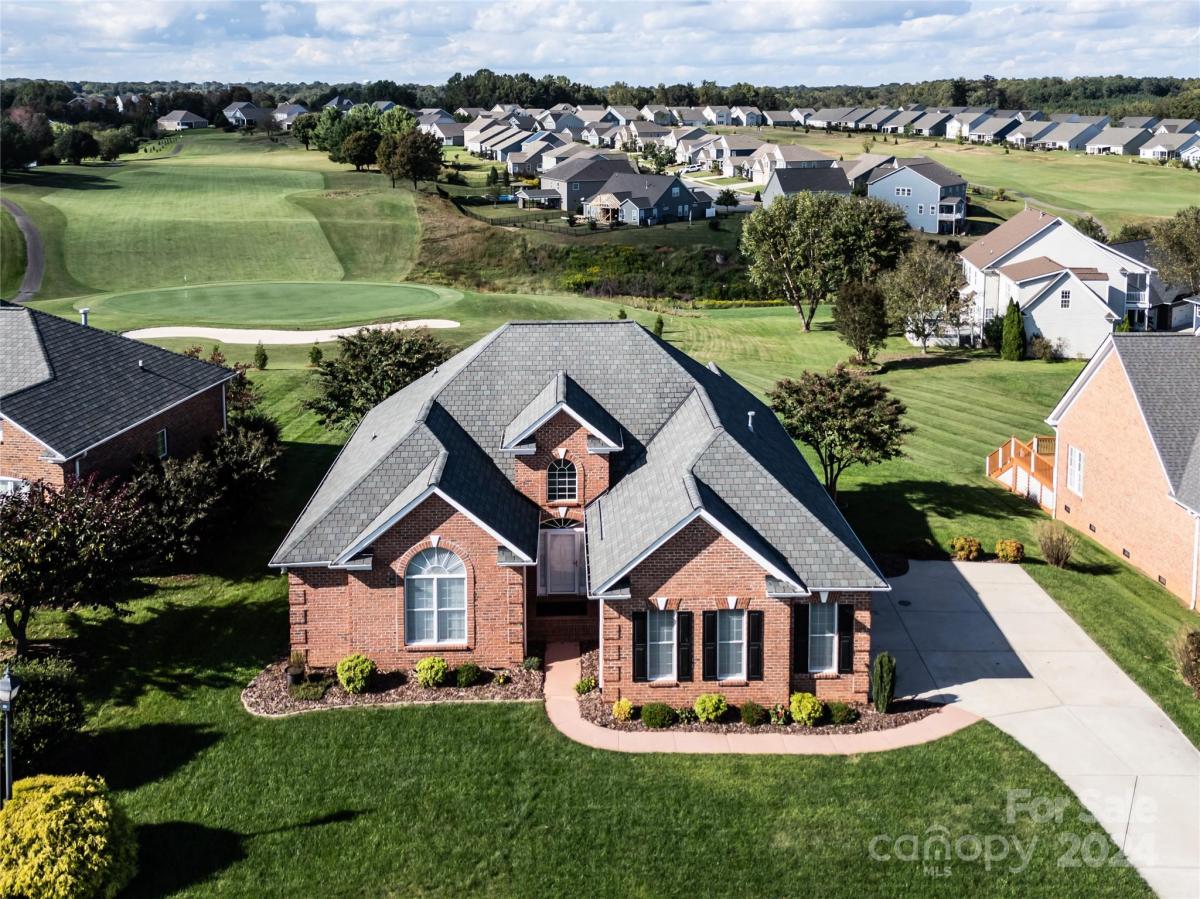
Cornelius Homes
In March 2019 43 homes sold in the Cornelius real estate market, a 105% increase from the 21 Cornelius homes sold in February 2019. March 2019 sales figures increased 13.2% from March 2018 when 38 homes sold in the Cornelius real estate market.
The average sales price in Cornelius decreased by 35.8% from $727,057 in February to $467,100 in March. March 2019 average sales price decreased 11.6% from the March 2018 average sales price which was $528,292.
Average days on the market decreased by 10.4% from 77 days in February to 69 days on the market in March. The March 2018 average days on the market were 61, a 13.1% increase in market time from one year ago.
Currently, there are 157 active homes for sale in the Cornelius real estate market, up 3.5% from March. The average list price of active listings is $909,049 down 7.7% from the March average list price of $984,731. There are 90 Cornelius homes currently under contract, up 23.3% from March. Based on these statistics, 1.2 months of inventory, we are currently in a seller’s real estate market in Cornelius.
It is a great time to sell Cornelius real estate! Request a free market analysis or keep updated on the Cornelius real estate market for free at LakeNormanHomePrices.com
Cornelius Condos & Townhomes
In March 2019 27 condos/townhomes sold in the Cornelius real estate market, a 125% increase from the 12 Cornelius condos or townhomes sold in February 2019. March 2019 sales figures increased 17.4% from March 2018 when 23 Cornelius condos sold.
The average sales price decreased by 11% from $236,675 in February to $210,649 in March. The March 2019 average sales price decreased 9% from the March 2018 average sales price which was $231,402.
Average days on the market decreased by 41% from 68 in February to 40 in March. The March 2018 average days on the market were 20, an increase of 100% market time from one year ago.
Currently, there are 63 active condo/townhomes for sale in the Cornelius real estate market, a 16.7% increase from the 54 Cornelius condos for sale in March. The average list price is $336,069, up .4% from March’s average list price of $334,709. 39 Cornelius condos/townhomes are currently under contract, an 8.3% increase from March. Based on these figures, 1 month of inventory, we are currently in a seller’s market for Cornelius condos.
Cornelius Lots
In March 2019 2 lots sold in the Cornelius area, a 0% increase from the 2 Cornelius lots sold in February 2019. March 2019 sales figures increased 0% from March 2018 when 2 Cornelius lots sold.
The average sales price decreased by 51% from $712,500 in February to $348,500 in March. The March 2019 average sales price increased 116% from the March 2018 average sales price which was $161,000.
Average days on the market decreased by 58% from 180 in February 2019 to 76 in March 2019. The March 2018 average days on the market were 4, an 1800% increase in market time versus the same time period last year.
Currently, there are 22 active lot listings in the Cornelius real estate market, an increase of 38% from March. The average list price is $837,809, down 3.7% from March’s average list price of $870,425. There are 9 Cornelius lots currently under contract, a 10% decrease from March. Based on these numbers, very limited Cornelius land inventory, we are in a seller’s market for Cornelius lots for sale.
Search Cornelius homes for sale
Cornelius waterfront homes for sale
Search Cornelius condos for sale
Cornelius waterfront condos for sale
Would you like to stay up to date on the Cornelius real estate market: Free Cornelius Real Estate Market Updates